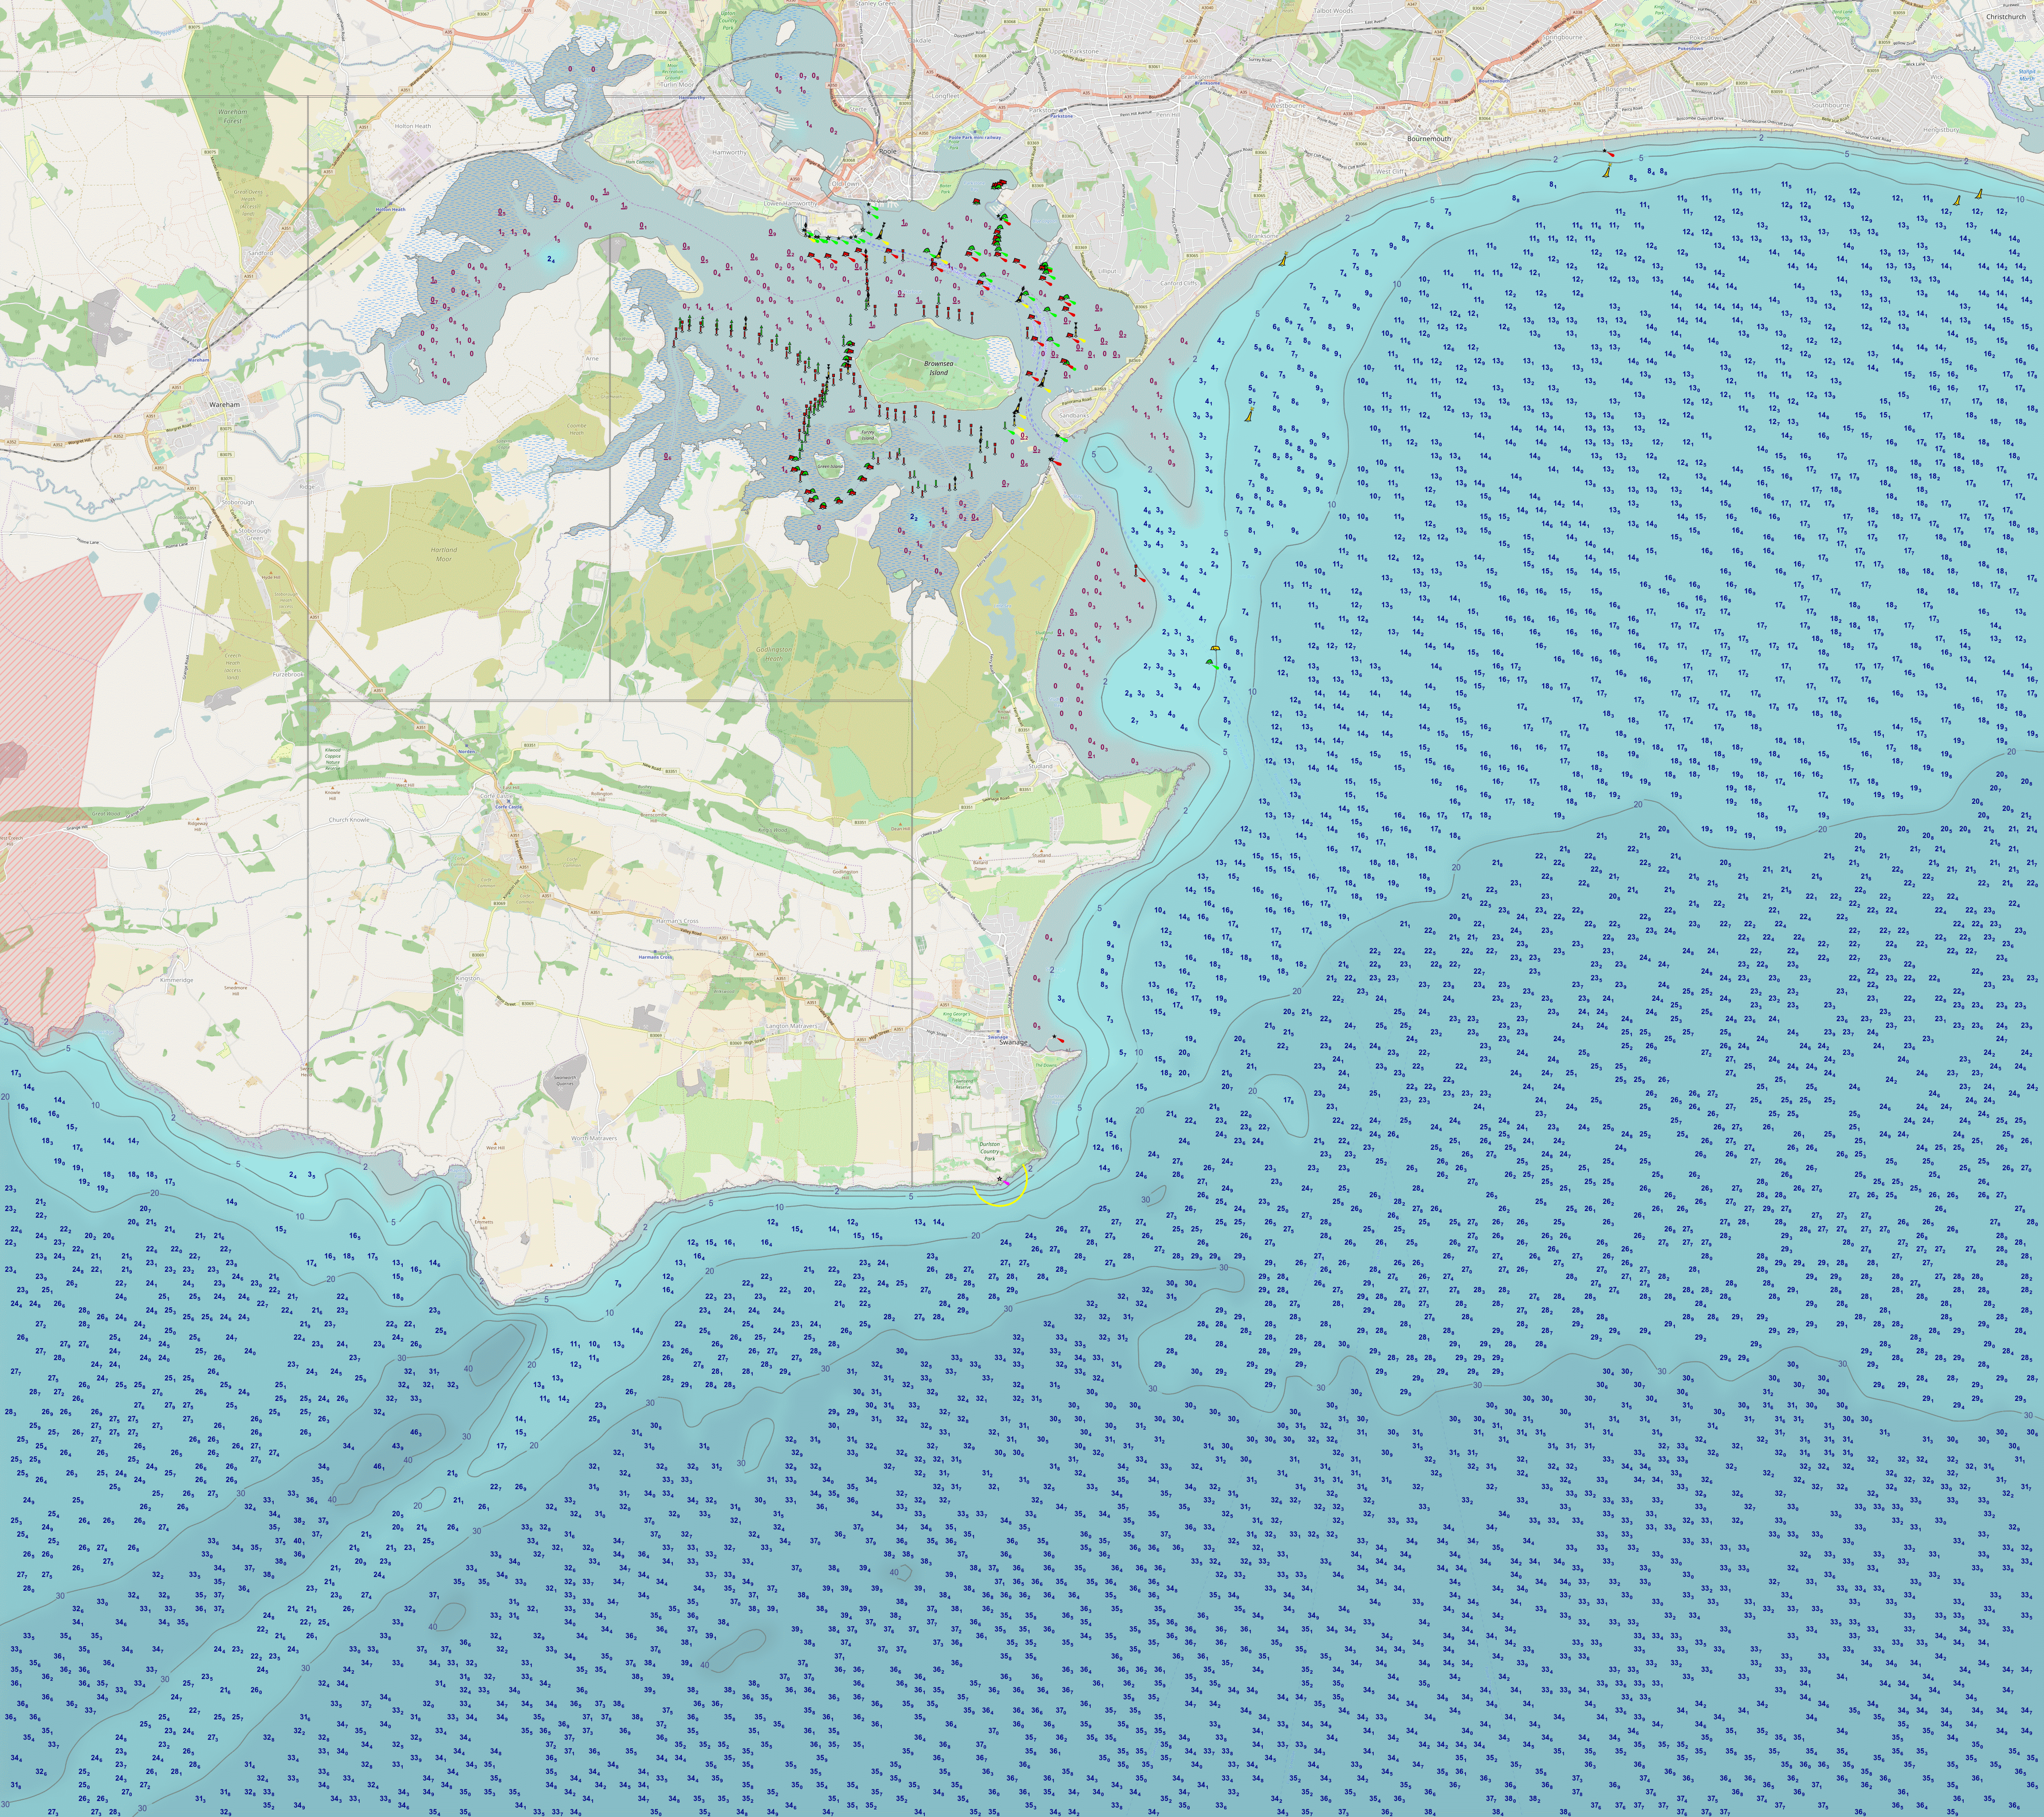
Welcome to the home of "OSMDCON", a Software Development to superimpose Depth Text, Contours and Seamarks onto OpenStreetMap images. Click on the image below to view a full scale example...........
Please click on the Links for further information on the product.
| What OSMDCON does | Getting Started | Processing | Custom Seamarks | Image Overlays | |
| Notes | Disclaimer | Acknowledgments | Contact |
|
The software was developed in response to the need for a program that takes freely available water depth data and overlays that data in the form of text and contour lines on an OpenStreetMap map. It takes the 256X256 pixel map image "tiles" from OpenStreetMap, and similar for Seamarks from OpenSeaMap, to produce a chart with a user-defined amount of depth detail. (Seamarks are features like buoys, beacons, anchorages etc.) The user does not need to be familiar with the quirks of the OSM system; just select a chart area on a world-wide GUI map, a few clicks and wait a few minutes..... You will need a PC with a broadband connection running Windows XP or later, with at least 2GB of RAM. Faster performance is obtained if the machine has multiple processors, and a solid state disk drive. About 10 to 50GB of disk space is required for the software and, (the major part), the data; it depends on how large an area you need to work on. The system has been extensively tested on a dual 3.4Ghz processor with 4GB RAM and a 120GB SSDD, yielding elapsed times of around 3 minutes per run. A note about solid state disk drives; if you haven't got one - get one! They're about 40GBP on Ebay and currently represent the most cost-effective upgrade available. Anyway, onwards........ The software may be downloaded from https://sourceforge.net/projects/osmdcon/ . Using "Administrator Rights" if applicable, install into C:/IMAGE_PROCESSING by specifying C:/ as the initial folder. Navigate to "C:/IMAGE_PROCESSING/lib/setup/setup.tcl" Edit with a Text Editor the file setup.tcl near the top as follows: # new user? please change this.......... # end SSDD Change the drive letter on the SSDD line to the drive letter of your Solid State Disk Drive, e.g. E: , or delete the line completely if no drive present. Now download Tcl/Tk from the Activestate web site. Be sure to choose the x86 version of release 8.6.4.1 Start the resultant .exe file and install into the folder C:/Tcl (the default). Download tcllib-x.xx.zip from the Sourceforge site. Unzip into a temporary folder and run installer.tcl in that folder by simply clicking on the file, as you would for a normal .exe or .bat file. Apart from loading some required extensions to Tcl, this proves the successful installation of Tcl/Tk. Now run AAA_setup.tcl in the C:/IMAGE_PROCESSING folder. This sets an environment variable for Tcl/Tk, and downloads more required Tcl "extensions". For further proof, start AAA_OSM_MAP_DISPLAY.tcl in C:/IMAGE_PROCESSING. A map should appear built dynamically from tiles at the OpenStreetMap site (Internet required) , with landscape and portrait rectangles following the mouse. Good. Navigate to C:/IMAGE_PROCESSING/lib/IMAGEMAGICK and run ImageMagick-6.9.6-3-Q16-HDRI-x86-dll.exe . This will install ImageMagick on your system. Allow it to update the system path. Please note that OSMDCON will only work with this version. We then need to download an amount of data from various sources, as follows: a) EMODnet depth data from the EMODnet portal. Select a layer in the drop-down panel until "Download products" appears, then click on "Download products". You should see a gridded map of Europe. Click on the grid for your required area. A panel will pop up showing the cell name, e.g. B3, and a list of download types. Select "Download as EMO file". A download of file e.g. B3.emo.zip will commence. Repeat for multiple cells if needed. Not in Europe? See Processing later. The resolution of EMOD data is approximately 200 X 200 metres - better than the "30 arc seconds" of GEBCO. b) Land Polygons from OpenStreetMap Data . Choose the file for "Large polygons are split", Shapefile, and WGS84. c) Seamark Data from OpenStreetMap Data Extracts . E.g. great-britain-latest.osm.pbf and ireland-and-northern-ireland-latest.osm.pbf . Be sure to choose .osm.pbf files! If you're only interested in the UK and Ireland, you can skip this step. Confirm that the following folders exist: X:/CHART_DATA X:/CHART_DATA/TILES X:/CHART_DATA/PNGS where X is either the SSDD letter or C if no SSDD, as applicable. These were created by AAA_OSM_MAP_DISPLAY.tcl above. Unzip the downloaded data files in a) and b) into X:/CHART_DATA . Copy the file(s) in c) to the same folder. Now we can create the SQLITE Database files needed by OSMDCON: i) Depth Data Edit with a text editor the file C:\IMAGE_PROCESSING\OSMDCON_bounds.inc . Consider the following at the top of the file, (it represents a "bounding box" of all the charts that we'll possibly need) , # ############################################ and change the values to form a rectangle encompassing your area. There is no need to be that accurate, in fact, over-estimate the coordinates by 0.25. The values as supplied represent the UK and Ireland, so you would need B2.emo and B3.emo from EMODnet. The larger the rectangle, the longer the ensuing processing will take; only define a bounding box for your needs! Save the file and start C:\IMAGE_PROCESSING\AAA_depths_emo_to_DB.tcl . Select a file named Xn.emo, e.g. B3.emo , and answer Yes to "Initialise the DataBase". It will take a while..... When the total records stats are displayed on the console, type x to exit the program. Repeat the run for additional .emo files, but reply No to the initialisation of the database. ii) Land Polygons Start C:\IMAGE_PROCESSING\AAA_land_polygons_to_DB.tcl . It will ask for a .shp file. A .shp file is used in geographical information systems (GIS) software. shp is short for shape. Select the unzipped polygons .shp file in X:/CHART_DATA , typically land_polygons.shp . It will take a while..... When the total records stats are displayed on the console, type x to exit the program. iii) Seamarks Data One more to go........... Start C:\IMAGE_PROCESSING\AAA_OSM_PBF_to_SEAMARKS_DB.tcl . Run in a similar fashion to Depth Data, selecting file(s) from c) above, e.g. great-britain-latest.osm.pbf . If you skipped c) above, copy SEAMARKS.DB from folder C:\IMAGE_PROCESSING to X:/CHART_DATA .
Phew! About 2 hours (or less) will have elapsed - was it worth it? Well let's consider what we've downloaded and installed: iv) A powerful high-level programming language in Tcl/Tk. v) An extensive data set of depths, land polygons and seamarks. vi) A comprehensive image manipulation tool - ImageMagick. More than worth it...... You could even charge your mates a beer for producing charts for them! Right, let's get into what we're here for - producing charts.
|
|
In AAA_OSM_MAP_DISPLAY.tcl , position the mouse so the rectangles encompass an area within your "bounding box", with a mix of land and water. Left click, select Yes, and select landscape or portrait. This will kick off OSMDCON, which will initially download image "tiles" from the OpenSxxMap sites and create 4 files, viz. UNDEFINED.cha , UNDEFINED.png , UNDEFINED.seam.png and UNDEFINED.merged.png . The .cha file is a one-line "info" file containing information about the image files. The .png file is the "raw" OpenStreetMap file, the .seam.png is the seamarks (buoys, lights etc.) file from OpenSeaMap, and the .merged.png is simply an image file with the seamarks overlaid on the .png file. In fact, OSMDCON can be used simply to create chart images (.merged.png and KAP) with only seamarks overlaid on them - examine processing_values.inc . The software next reads the land polygon and depths databases, producing a solid base of data, e.g. ensuring that depths are not on land! Don't laugh - there are frequent instances of just that! There is then an extensive processing phase, where that data is superimposed on the .png file above. Finally, the .seam.png file is glazed over the resultant file and then a KAP file produced, suitable for OPENCPN, SEACLEAR etc. An option is offered to rename the UNDEFINED files generated to something "more meaningful" - always a good thing. In total, it should take ~3 minutes. The file processing_values.inc may be edited to change the number and depths of contour lines, text density, colours, etc. For example: set depth_text_density 0.4 ; # depth text density, range ~0.3 to 0.9, or > 99.0 for no depths text e.g. 9999.0 can be changed to e.g. 0.7 for depth text less dense, or 0.3 for more dense. Examine the contents of the file anyway; it gives an idea of what's going on. Then have a go at experimenting with various values - but make a copy first! There are two other ways of running OSMDCON; using an existing .cha file as the input parameters, or simply running with no input parameters. To use an existing .cha file, start AAA_OSMDCON_from_CHA.tcl . Select the required .cha file from the selection list. This method is typically used when you're happy with the geographical location of the chart, but have made adjustments to the processing values as above. The other method is simply to run AAA_OSMDCON.tcl . It will take the values in processing_values.inc : # enter chart details here: ( used when OSMDCON is started with no run parameters) # Southampton Water: set chart_area "Southampton Water" # end chart details together with osm_zoom_level and orientation . Note however, that the chart generated will seldom exactly match the coordinates specified, due to the 256X256 pixel OSM "tile" process. Users outside Europe who have access to local depth data can play with AAA_depths_OTHER_to_DB.tcl . Examine the file to see the format of the input file(s). If you're into ultra-high definition depth data in the UK, check out http://aws2.caris.com/ukho/mapViewer/map.action - but be warned, it could quickly fill up your disk(s)! It might be an idea to use this data only for coastal tracts of less than ~7 metres depth, areas where EMOD and GEBCO are not very strong.......
|
|
There is a folder, C:\IMAGE_PROCESSING\SYMBOLS , containing Custom Seamark icons in "transparent .gif" format. Two examples: Use CUSTOM_CHART_SYMBOLS.tcl to set the position of symbols on a chart, if required. The information of each symbol icon is stored in the CHART_SYMBOLS.DB file, not on the chart image file. A description of the Custom Seamark may be entered if needed. Icons are overlaid on the chart in a phase of OSMDCON, if the option is set. More icons may be added to the SYMBOLS folder in conjunction with an image editor such as IrfanView, (to set the transparent colour). Type help in the console I/O: line for info.
|
|
For those users who are into "vector layers", note that all layers are available as .png files when a run of OSMDCON is completed. These layers could potentially be defined and utilised in your PC chart plotting software. The layers are created regardless of the settings in processing_values.inc .
|
|
Use C:\IMAGE_PROCESSING\TCL_COLOURS\COLOUR_DISPLAY.tcl to show the colour range available in Tcl. Left click a "colour band" to copy that colour to the clipboard. Note colour names are case-sensitive. You will have noticed a processing parameter in processing_values.inc named "apply_tide_height" . If this is set to Y the system will apply the current tide height to the L.A.T. depth values read from the depths Database. It uses Wxtide32, see the web site http://www.wxtide32.com/ . Ensure that Wxtide32 chooses a tide station that accurately reflects the tide state for your charts! There is help in C:\IMAGE_PROCESSING\lib\TIDES\USE_THIS_FOR_HELP.tcl . The facility could be used, say, to refresh a chart image in an on-board PC chart plotting program - no Internet required.
|
|
The depth data at EMODnet is reasonably accurate at depths over 10 metres. At depths less than this, it's erratic to say the least. This program is distributed in the hope that it will be useful, but WITHOUT ANY WARRANTY; without even the implied warranty of MERCHANTABILITY or FITNESS FOR A PARTICULAR PURPOSE. The author assumes no liability for damages arising from use of this program OR of any data that might be distributed with it. You should not use this program or any data files that might be associated with it if anyone or anything could come to harm as a result of an incorrect depth or tide indication. The user of this software is strongly urged to set "show_shallow_depths" to Y for one run to examine the depth data used for that chart, especially in areas that have extensive tidal flats. In addition, please visit http://www.emodnet-bathymetry.eu/data-products/disclaimer . Note that EMODnet uses GEBCO data, either absolute or interpolated, to fill gaps in the 200X200 metre grid.
|
|
Recognition and thanks are due to the authors, creators and suppliers of the following: The OpenStreet(Sea)Map project Imagemagick Wxtide32.exe imgkap.exe surfit osmconvert.exe EMODnet data GEBCO data shp2pgsql.exe Tcl/Tk and associated extensions
|
|
The author can be contacted at: gdpound at msn dot com Please do not hesitate to request help or advice, no matter how trivial you may think it is!
|
